





How Many Teeth Do Adults Have? 32 on Paper, 28.5 in Real Mouths — and 20 Is the Line That Counts

Every anatomy chart you have ever seen answers the question with the same number: thirty-two. Sixteen above, sixteen below, four of them wisdom teeth. It is a clean number, and like most clean numbers it describes a mouth almost nobody owns. The chart is the map. Your mouth is the territory, and the two stopped agreeing a long time ago.
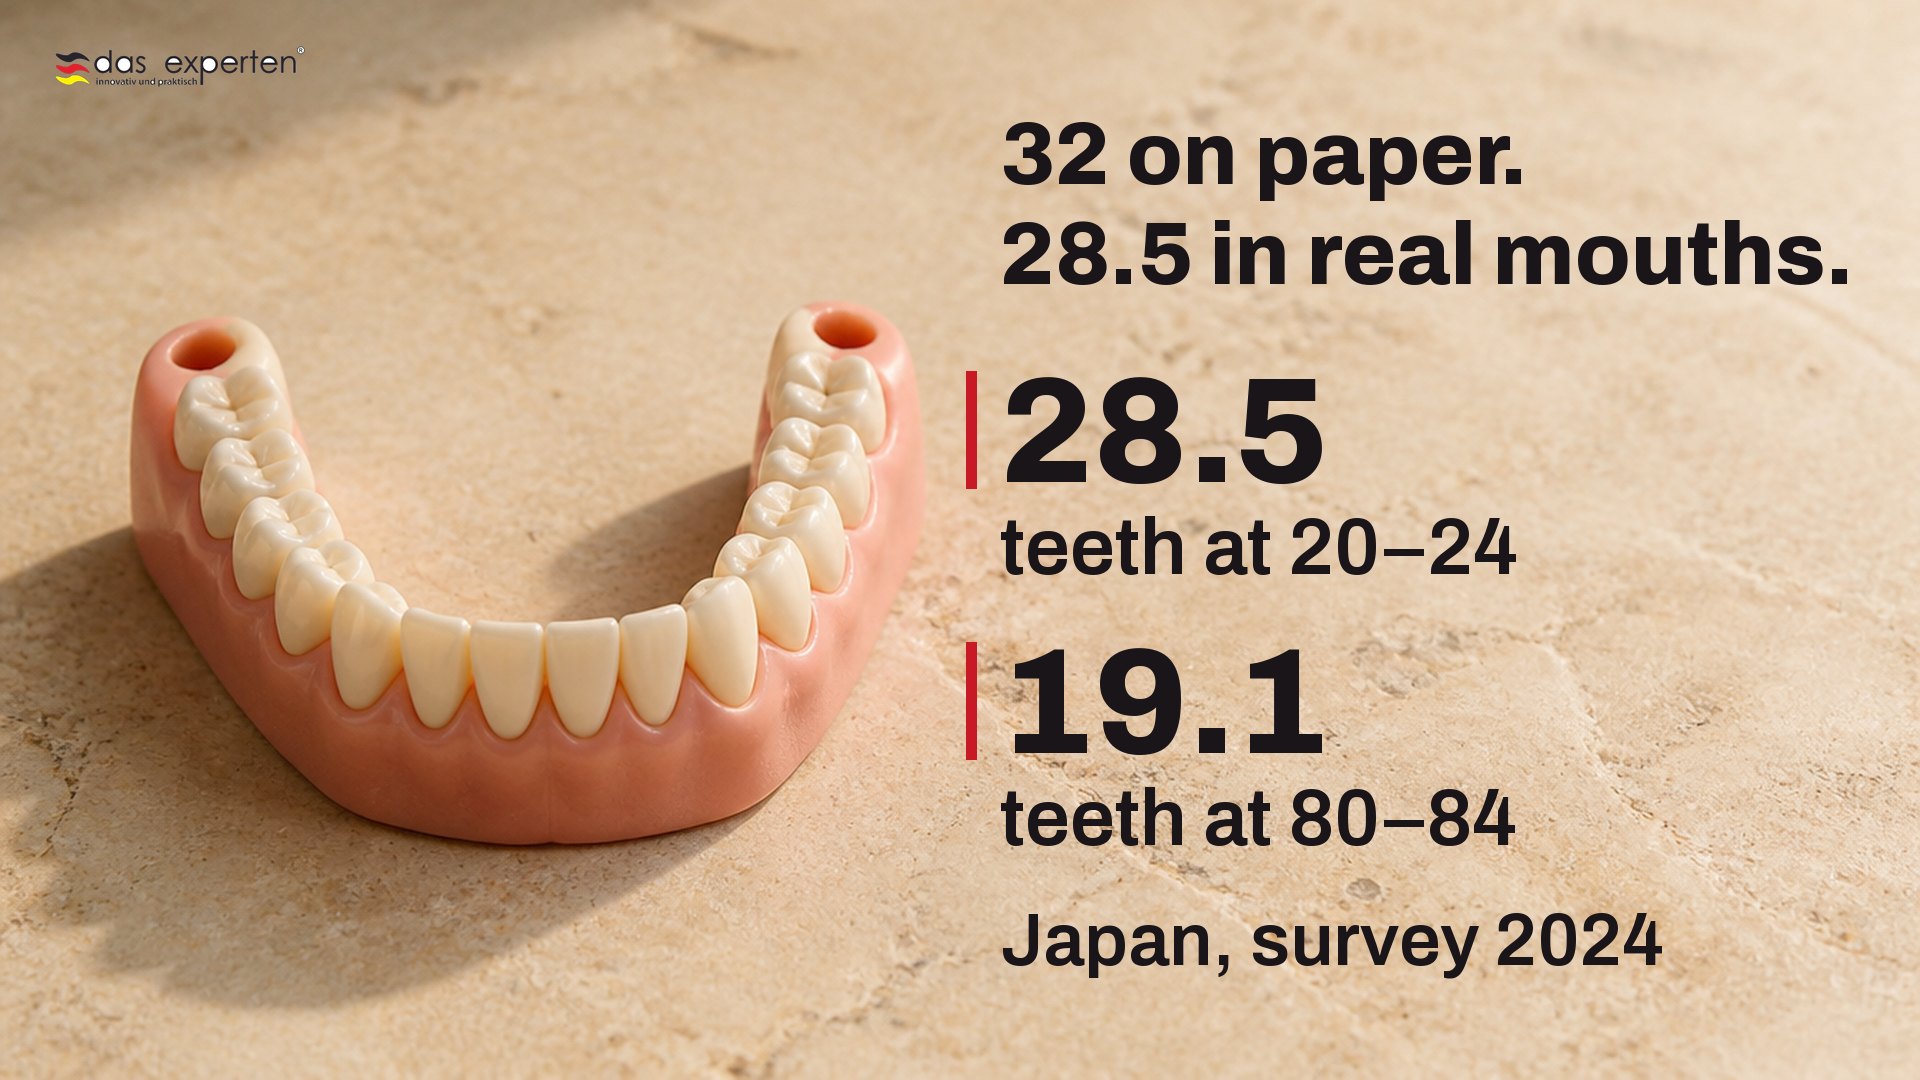
So, how many teeth do adults have? On paper, 32, after the 20 baby teeth that came first. In real mouths, fewer. When Japan’s health ministry examined its population in 2024, people aged 20 to 24 — the youngest adult mouths in the survey — averaged 28.5 teeth. At 80 to 84 the average was 19.1. The distance between those two figures, and the shape of the road between them, is the whole story.
The four teeth the chart counts and nature skips
Start with the wisdom teeth, because they explain most of the first missing four. A 2015 meta-analysis from Harvard pooled 92 studies and 63 314 people. In 22.63 % of them at least one third molar never formed at all — not removed, never there. Depending on the population the rate swung from 5.32 % to 56.0 %. Women were 14 % more likely than men to be missing one.
Of the wisdom teeth that do form, many never finish the journey. A companion analysis of 49 studies and 83 484 people aged 17 and over found at least one impacted third molar in 24.4 %: stuck in the bone, tilted, most often in the lower jaw. Add the ones that never formed, the ones that stayed stuck and the ones a surgeon took out before you turned 25, and 28 is not a deficit. It is the ordinary adult mouth.
You may have had yours removed in one afternoon and forgotten about it within a week. Or you have never seen them on an X-ray and assumed they were simply late. Either way, the chart still says 32, and you have been measuring yourself against a number that was never yours.
How many teeth do adults have at 50, 70 and 80?
Here the data turn uncomfortable, and in a very particular shape. The Japanese survey gives an average for every five-year band. From 20–24 to 50–54 the average falls from 28.5 to 27.4: about one tooth in thirty years. From 50–54 to 70–74 it falls from 27.4 to 21.3: six teeth in twenty years. By 75–79 the average is 19.5, and past 85 it is 14.5.
That is not a slope. It is a cliff with a long, flat approach. For three decades the mouth sends almost no signal, and people read the silence as safety. It is not safety; it is accumulation. The World Health Organization describes tooth loss as the endpoint of long-running disease — advanced decay and severe gum disease. Endpoints arrive late, and then they arrive together.
Look around a family dinner table and you can see the survey sitting there. The twenty-somethings have a full row and an open question about wisdom teeth. The fifty-somethings have a crown or two and no reason to worry. The seventy-somethings chew carefully on one side. Nobody at that table lost their teeth at the age they are now. They lost them one quiet tooth at a time, at the age of the person sitting next to them.
Why 20 is the number worth defending
In 1992 the WHO set a goal that sounds modest: a natural, working dentition of no fewer than 20 teeth for life. Japan had already turned the same idea into a national campaign in 1989 and called it 8020: twenty of your own teeth at eighty. Then it did something most slogans never do. It kept measuring.
In 1999, 15.3 % of 80-year-olds still had at least 20 teeth. In 2022 it was 51.6 %. The 2024 survey estimates 61.5 % — with a note from the ministry itself that the 2024 figures were weighted by prefecture population, so the method is not identical and part of the jump may be arithmetic rather than teeth. Discount it as heavily as you like: the direction does not change. The cliff can be moved.
Globally, the WHO estimates that almost 7 % of people aged 20 and over have lost every tooth, and 23 % of people aged 60 and over. That is the far end of the same curve, reached by people who spent their quiet decades believing the chart.
What keeps you above 20
Here is the asymmetry. The teeth you lose at 65 are decided at 45, during the thirty years when the average barely moves and nothing hurts. Nothing in that period feels urgent, which is exactly why it is the period that counts. The simplest thing you can change is the part of each tooth a brush head does not reach: the surfaces between neighbours.
That is the job of an interdental brush. Ours, INTERDENTAL S, is four small interdental brushes on a stainless core with polymer filaments. It adds nothing to the count. It is simply a way to clean the side of the tooth your brush misses, every evening, for the thirty quiet years — and a reason to let a dentist count your teeth before the curve does.
Thirty-two is the number on the chart; twenty is the one you will actually live with — and you are choosing which side of it you land on in the years when nothing seems to be happening.